Pawn Performance
Real Market Case Study
A comparative analysis conducted over three months for a broker processing $32.5 billion in retail volume demonstrates how the Pawn transforms high-risk b-booking into a stable, predictable business.
Net Profit
Without the Pawn
$3.7 million
With the Pawn
$2.9 million
Max Drawdown
Without the Pawn
33.5%
With the Pawn
0.12%
Drawdown Duration
Without the Pawn
25 days
With the Pawn
1 day
Sharpe Ratio
Without the Pawn
2.22
With the Pawn
21.45
Max Net Open Position (NOP)
Without the Pawn
$170 million
With the Pawn
$27.8 million
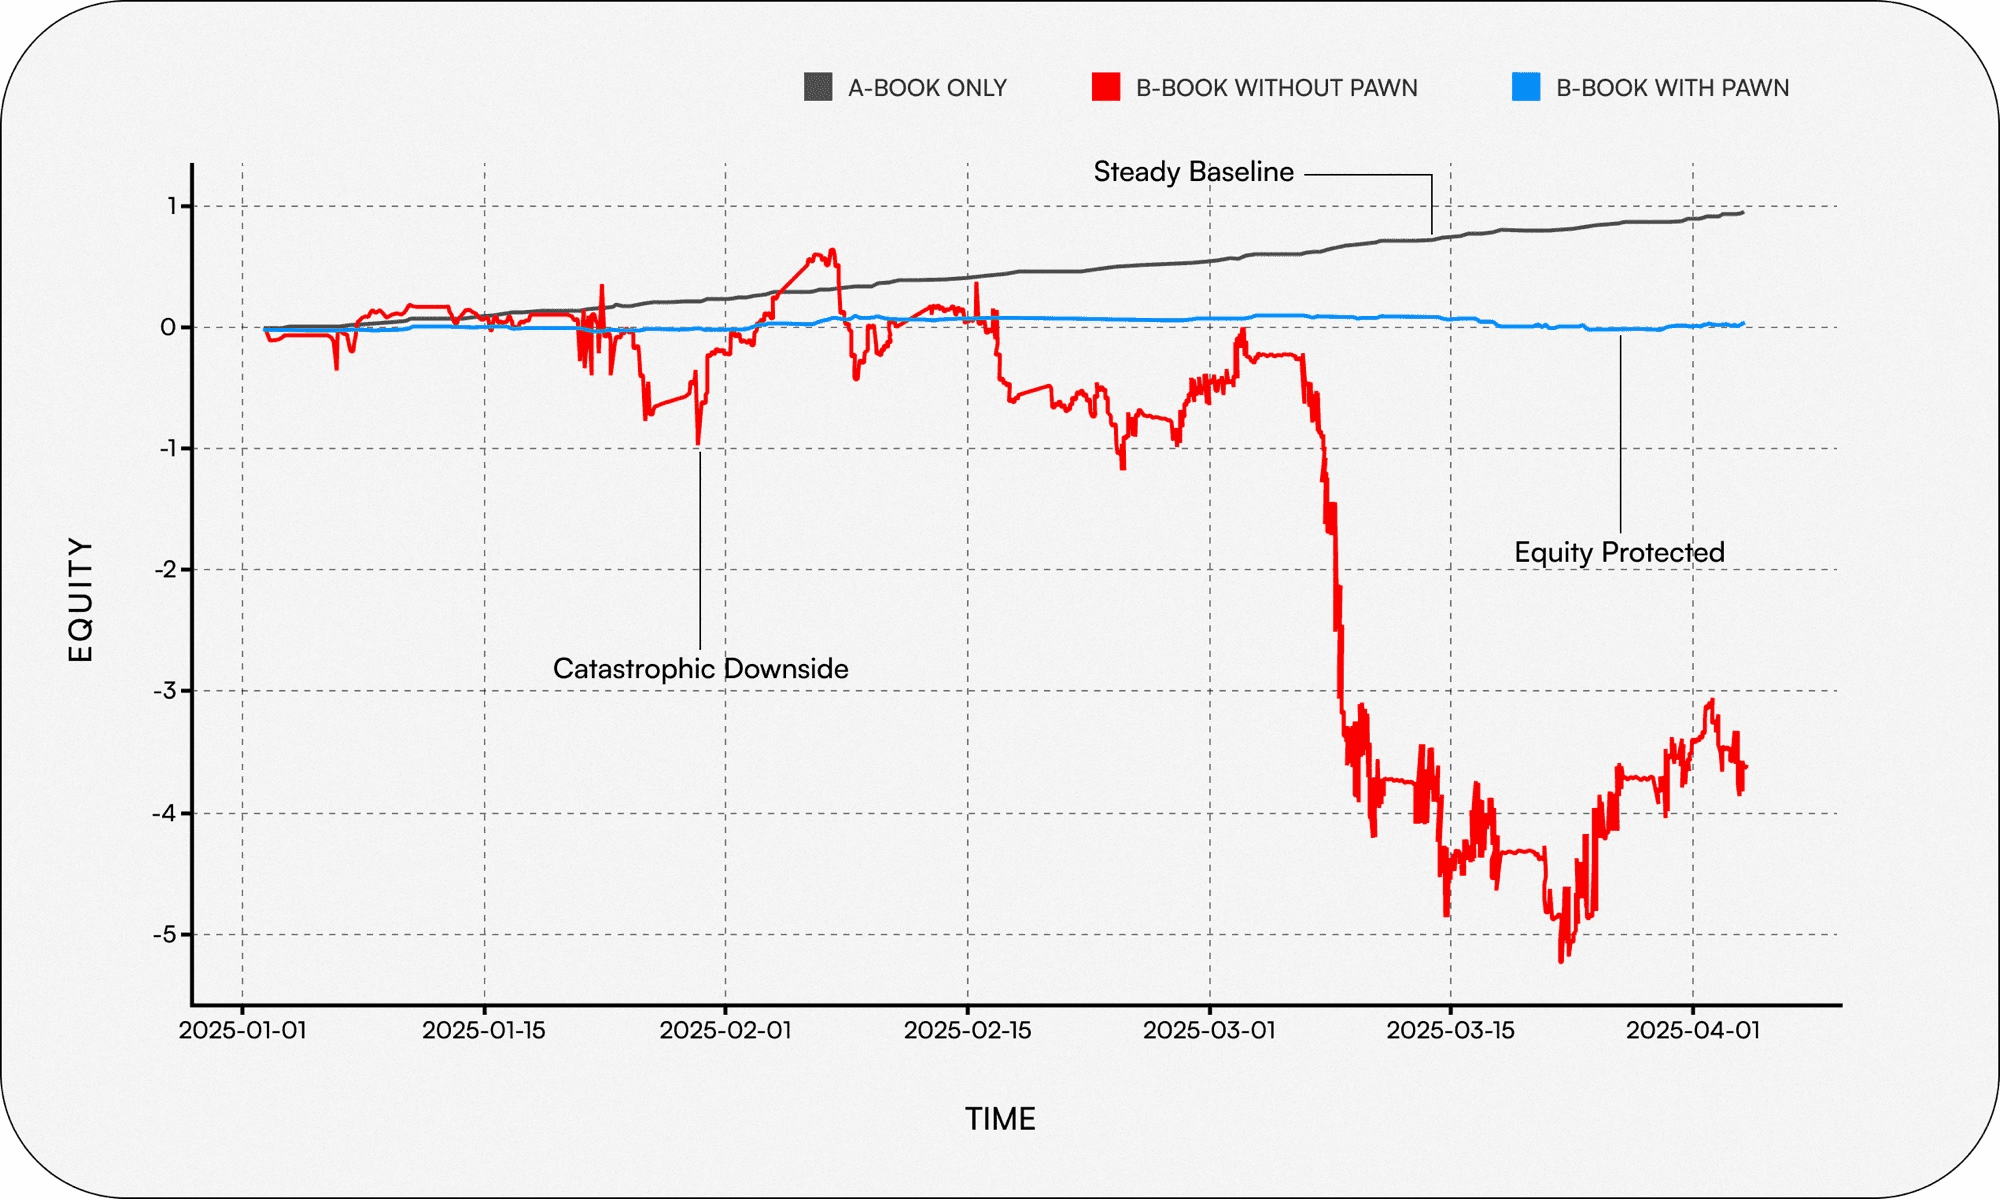
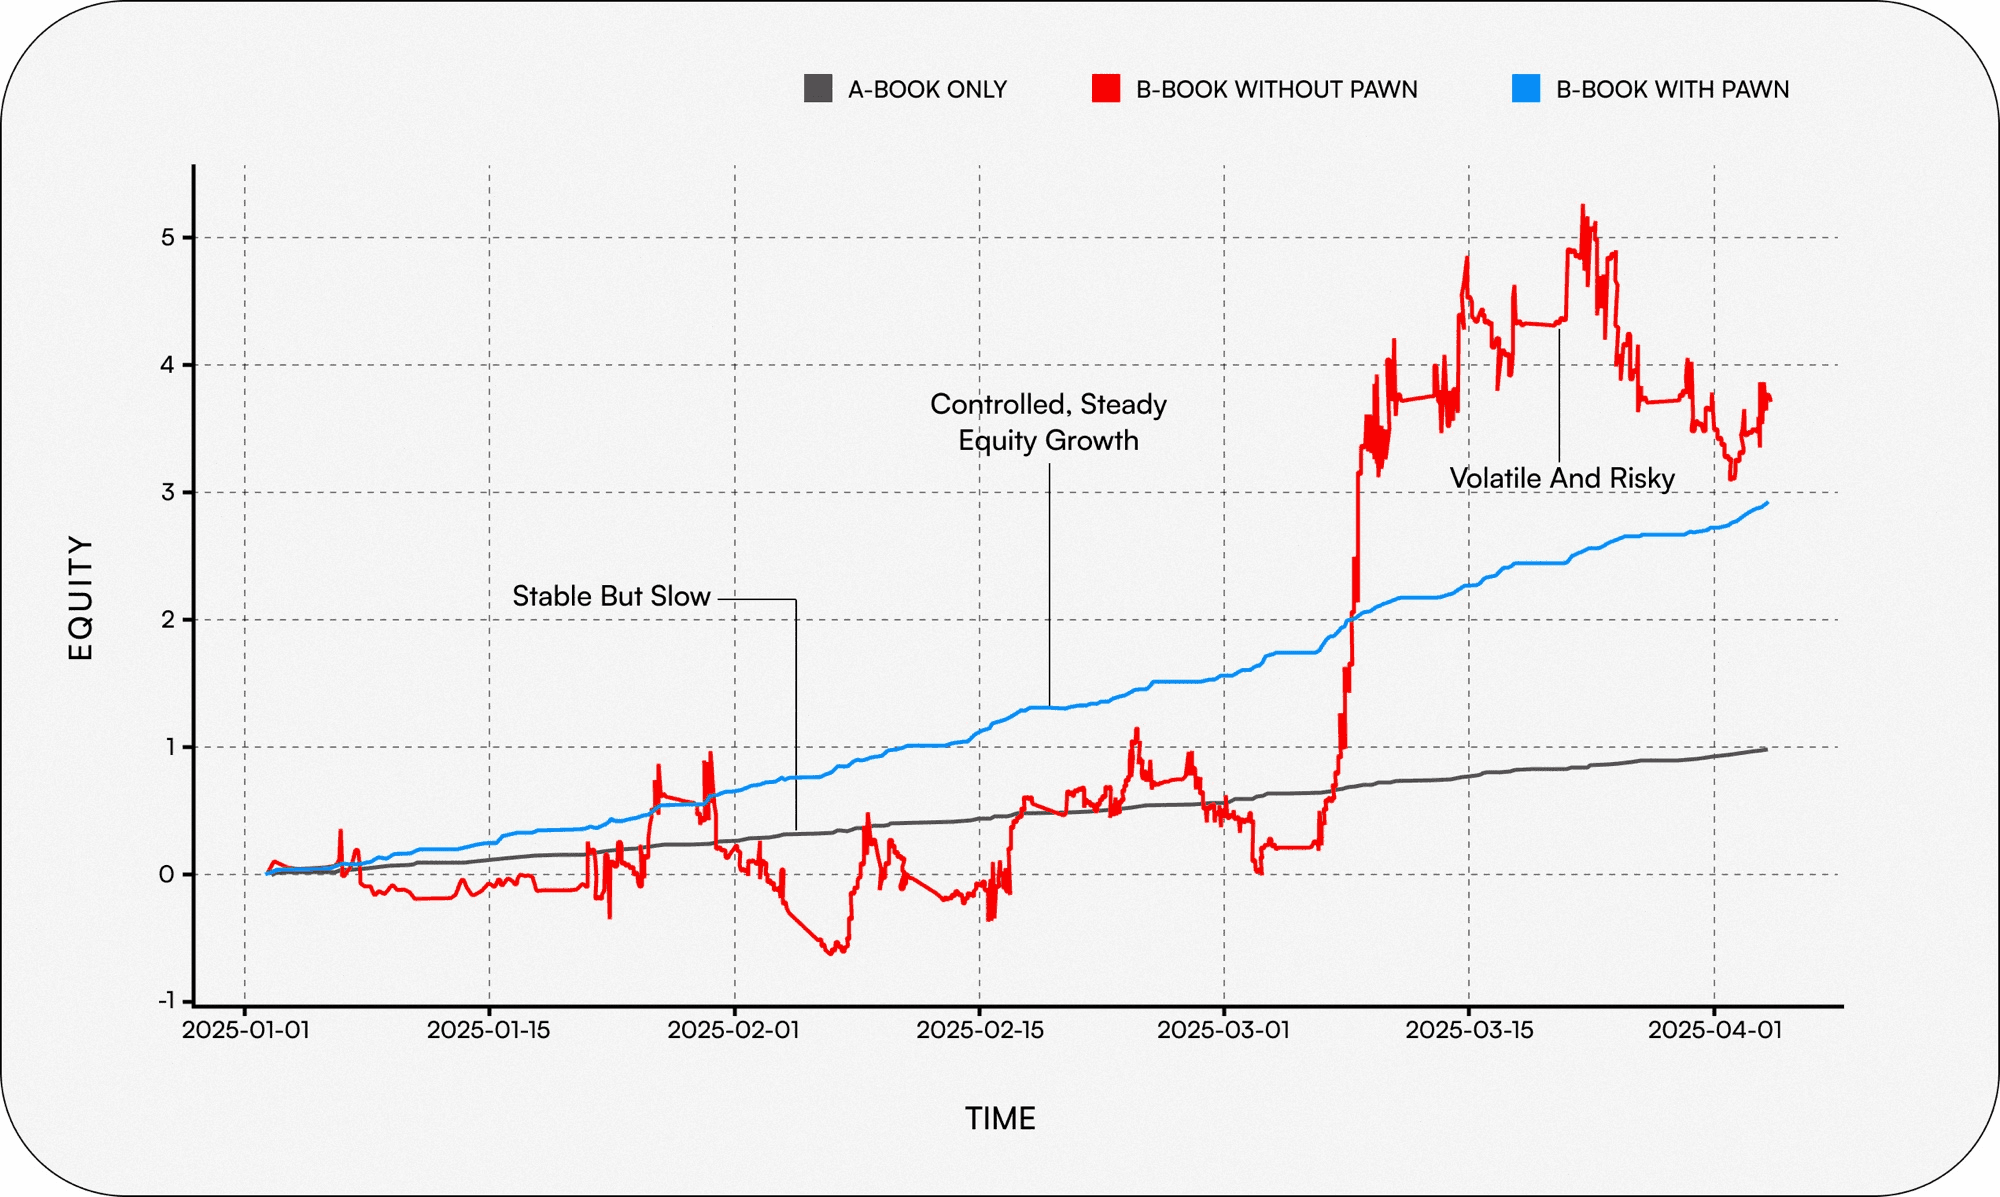
B-Book Equity Growth Chart
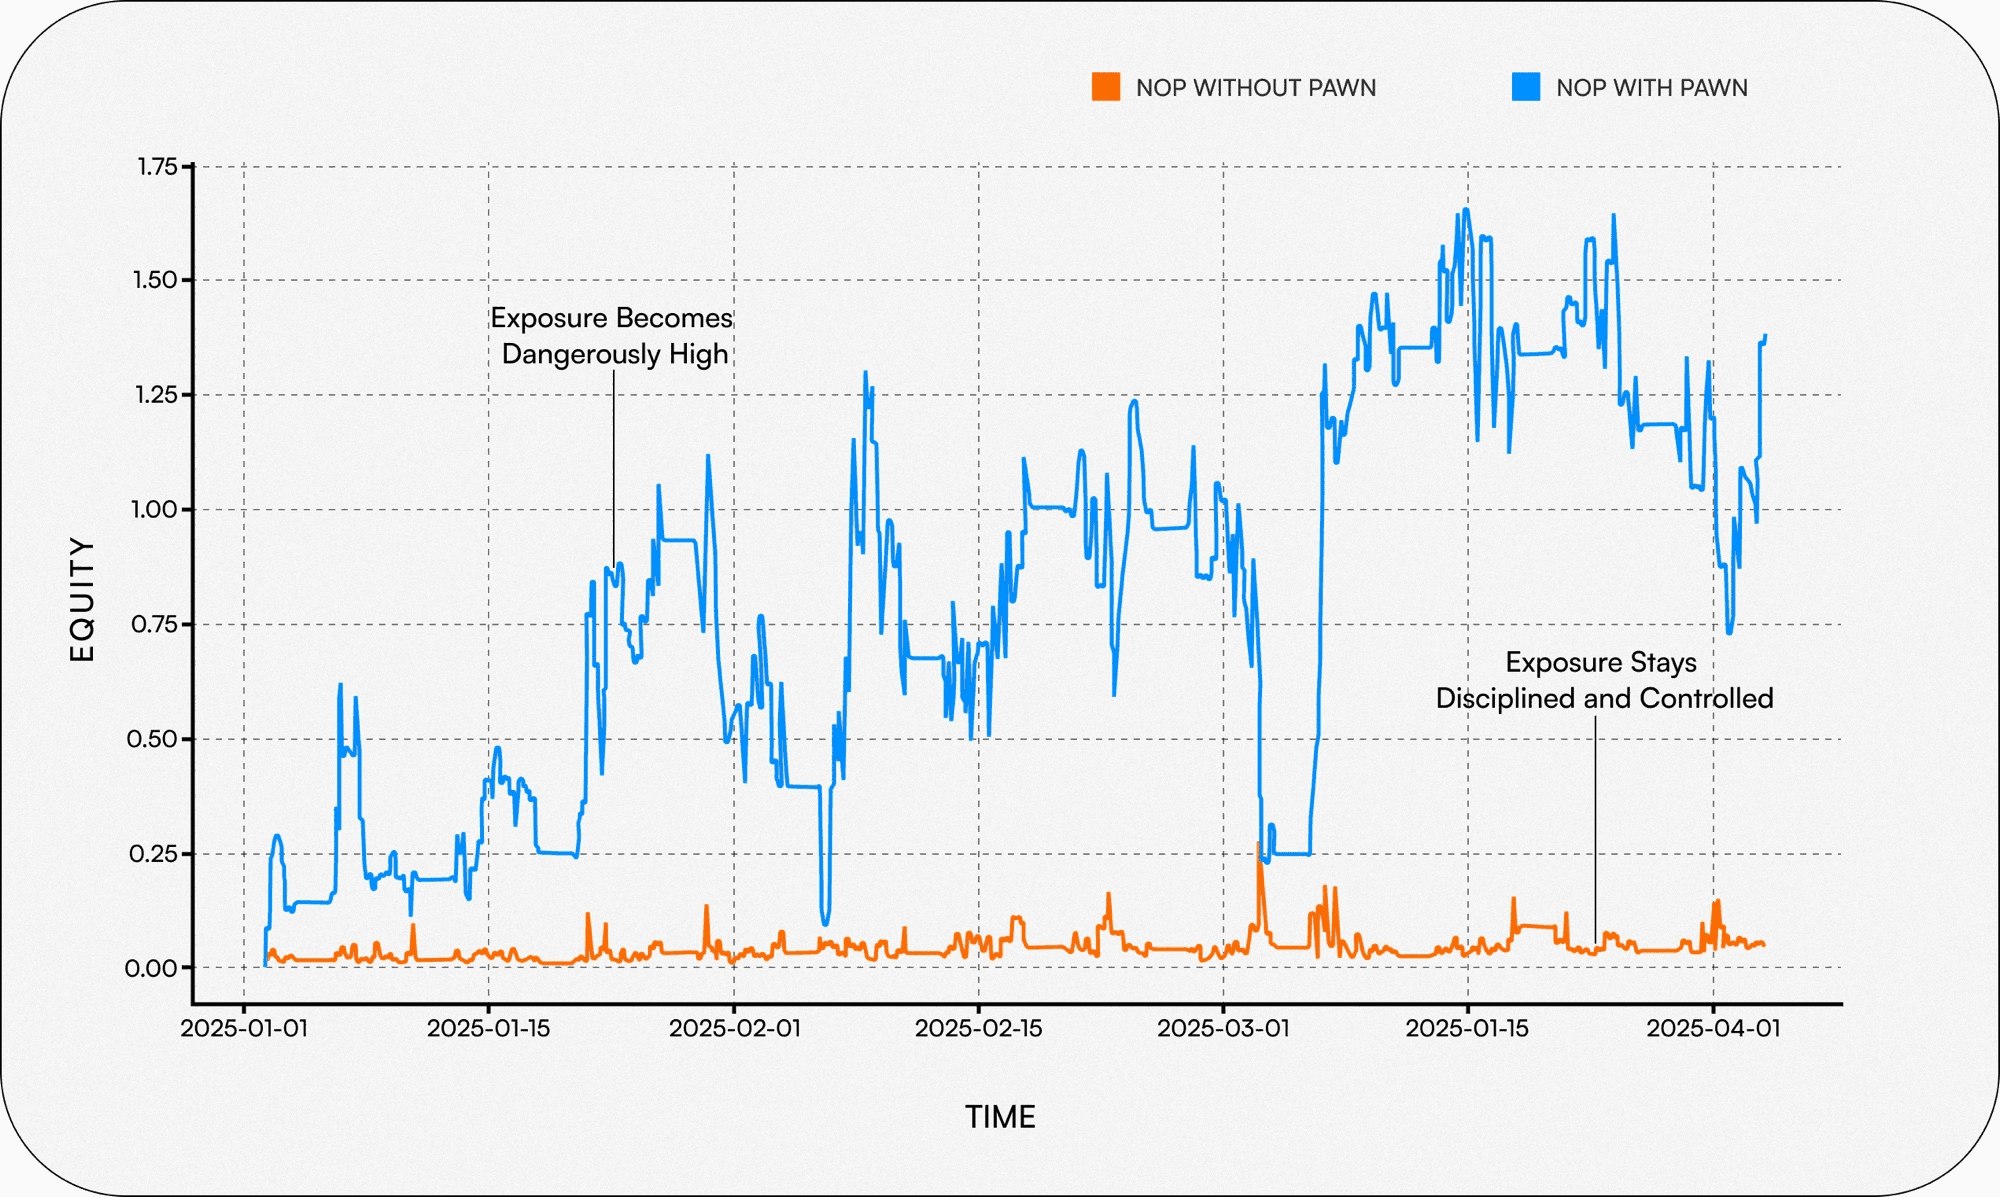
Net Open Position (NOP) Exposure Chart
Stress Simulation (Worst-Case Scenario)